Learn how to deploy ROSI Collector, connect client systems, view logs and metrics in Grafana, and troubleshoot common issues without depending on a specific hosting provider.
Tutorial: Deploy a Private, Centralized Observability Stack with ROSI Collector
Introduction
Managing logs and metrics across multiple Linux servers or VMs is difficult without centralized observability. ROSI (Rsyslog Operations Stack Initiative) Collector provides a self-hosted stack for centralized log aggregation and monitoring based on rsyslog, Loki, Grafana, and Prometheus.
This tutorial walks through a practical deployment of ROSI Collector, shows how to configure client systems, and explains how to use the included Grafana dashboards.
Key benefits:
Self-hosted deployment with full control over log data
Lower resource footprint than heavier observability stacks
Pre-built dashboards and optional TLS or mTLS support
Centralized aggregation for logs and host metrics from multiple systems
Prerequisites
One Linux server or VM for the collector (Ubuntu 24.04 recommended and tested)
Docker Engine 20.10 or later and Docker Compose v2
Root or sudo access
Basic familiarity with Linux, Docker, and YAML
Optional domain name for HTTPS and TLS-based syslog
Optional additional Linux servers or VMs to act as clients
For a small deployment, start with at least:
2 vCPUs
4 GB RAM
50 GB disk
Architecture Overview
ROSI Collector uses a central server that receives logs and metrics from multiple client systems.
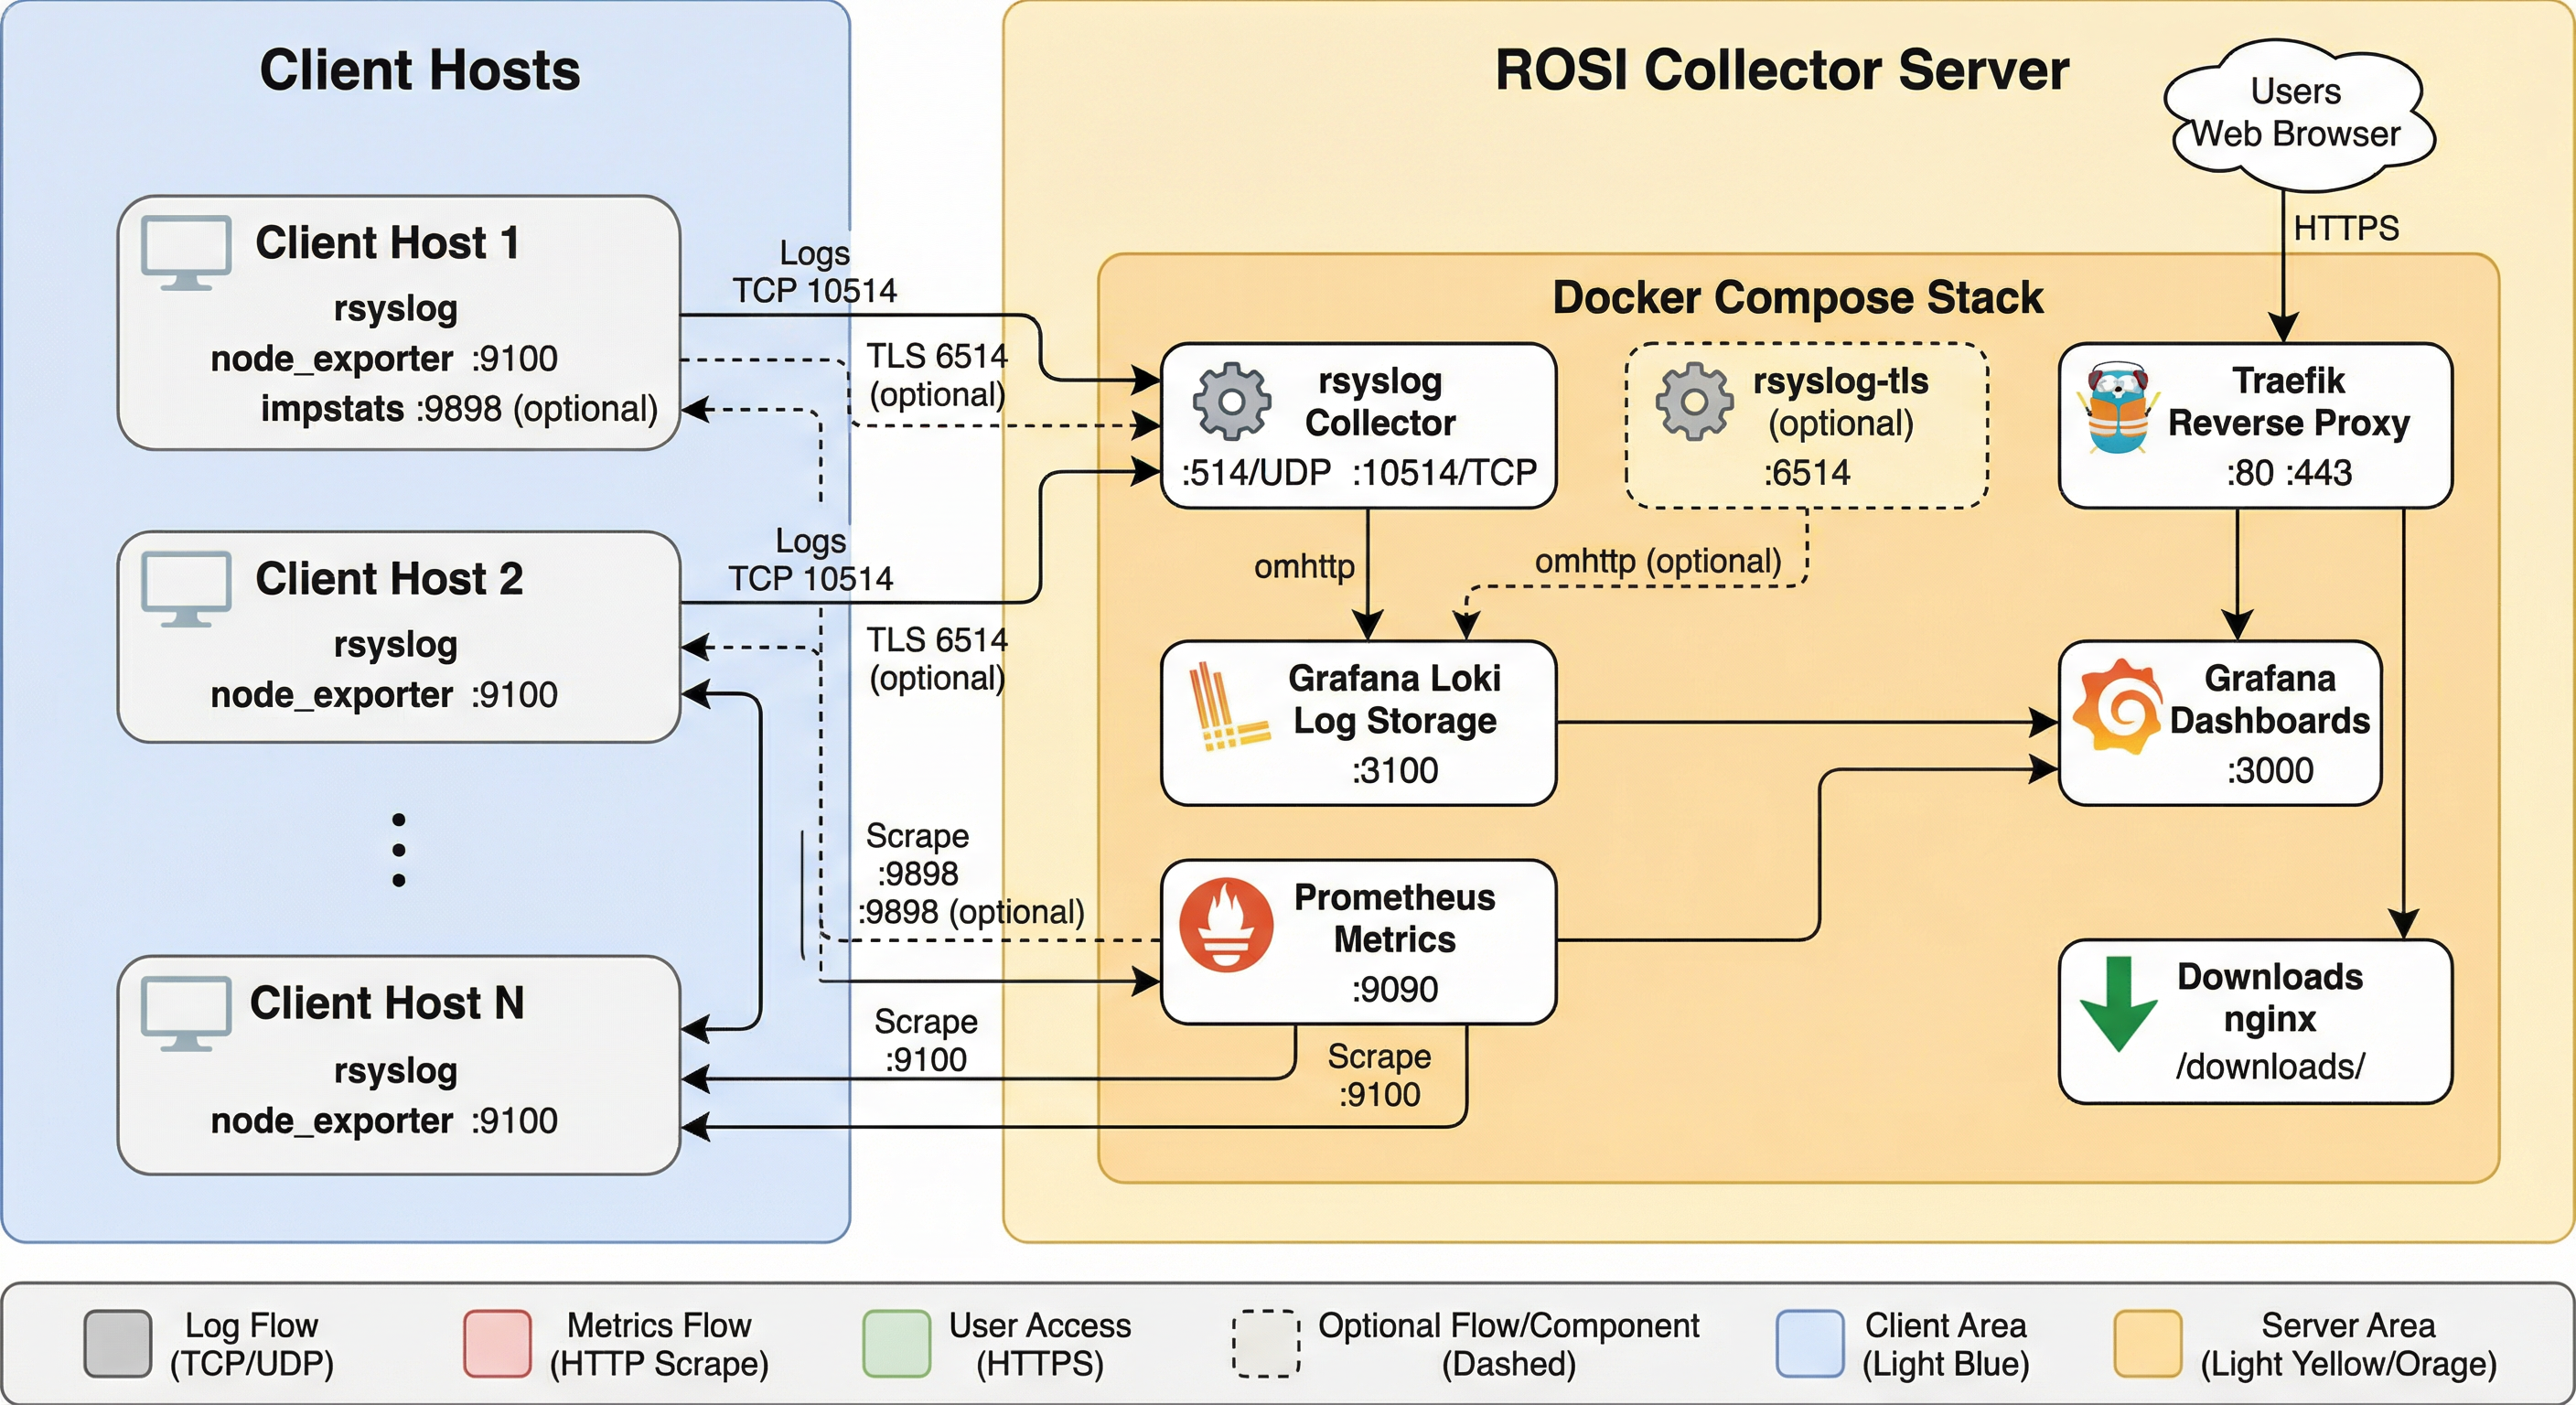
ROSI Collector architecture.
Components:
rsyslogreceives syslog from clients on TCP 10514 or TLS on 6514.Lokistores and indexes logs.Grafanaprovides dashboards and ad hoc log queries.Prometheusscrapes host and impstats metrics.Traefikprovides HTTPS access.node_exporterexposes host metrics on each client and optionally on the collector.
Network requirements:
Collector inbound: TCP 80, 443, 10514, and optionally 6514
Client outbound: TCP 10514 or 6514 to the collector
Client inbound: TCP 9100 from the collector for
node_exporter
Step 1: Deploy ROSI Collector
Clone the repository and move to the deployment directory:
sudo apt update && sudo apt upgrade -y
sudo apt install -y git curl
git clone https://github.com/rsyslog/rsyslog.git
cd rsyslog/deploy/docker-compose/rosi-collector
If this is a fresh server and Docker is not installed yet, run the preparation script once:
sudo ./scripts/install-server.sh
For automated setup:
sudo NONINTERACTIVE=1 ./scripts/install-server.sh
Initialize the environment:
sudo ./scripts/init.sh
The script prompts for:
Installation directory, default
/opt/rosi-collectorTRAEFIK_DOMAINas a domain name or IP addressTRAEFIK_EMAILfor Let’s Encrypt notificationsGRAFANA_ADMIN_PASSWORDor a generated passwordOptional TLS or mTLS for syslog on port 6514
Optional forwarding of the collector server’s own logs
Non-interactive initialization is also supported:
sudo TRAEFIK_DOMAIN=logs.example.com \
     TRAEFIK_EMAIL=admin@example.com \
     ./scripts/init.sh
If init.sh reports an error, stop there and resolve it before starting the
stack or onboarding clients.
For the full installation flow, available .env options, and TLS details,
see Installation.
Start the stack:
cd /opt/rosi-collector
sudo docker compose up -d
Verify services:
sudo docker compose ps
sudo rosi-monitor status
If a service fails to start, inspect logs:
sudo docker compose logs rsyslog
sudo docker compose logs grafana
sudo docker compose logs loki
Configure host and cloud firewall rules so the required ports are reachable. If your provider has a network-level firewall or security-group mechanism, mirror the same allow rules there.
Step 2: Configure Client Systems
For Linux clients, download the setup script from the collector:
wget https://logs.example.com/downloads/install-rsyslog-client.sh
chmod +x install-rsyslog-client.sh
Run the script:
sudo ./install-rsyslog-client.sh
The script configures rsyslog forwarding, creates the spool directory, tests
the configuration, and restarts rsyslog. It can also install an impstats
sidecar unless you pass --no-sidecar.
Send a test log message:
logger "Test message from $(hostname)"
Install node_exporter on each client if you want host metrics:
wget https://logs.example.com/downloads/install-node-exporter.sh
chmod +x install-node-exporter.sh
sudo ./install-node-exporter.sh
Verify it:
sudo systemctl status node_exporter
curl http://localhost:9100/metrics | head -5
Add the client as a Prometheus target from the collector:
sudo prometheus-target add 198.51.100.1:9100 host=webserver role=web network=internal
If the client also runs the impstats sidecar:
sudo prometheus-target add-client 198.51.100.1 host=webserver role=web network=internal
Open client firewall rules for node_exporter and, if used, the impstats
sidecar so the collector can scrape them.
For manual client configuration, TLS forwarding, Windows guidance, and target registration details, see Client Setup.
Optional: Add Windows systems
If part of your fleet runs on Windows, use rsyslog Windows Agent as the Windows-side collector and forwarder into ROSI Collector.
This is the supported path for integrating Windows Event Log data into the stack. rsyslog itself does not run natively on Windows; for background, see Does rsyslog run under Windows?.
In a mixed environment, the practical model is:
Linux systems use the ROSI client scripts described above.
Windows systems forward events with rsyslog Windows Agent to the same collector endpoint.
Grafana then lets you search Linux and Windows-originated logs together in the same stack.
For product details and deployment guidance, see:
Step 3: Access Grafana
Open Grafana in a browser:
https://logs.example.com
Or use the collector IP address if you are not using DNS:
https://203.0.113.10
Log in with:
Username:
adminPassword: the value shown by
init.shor stored in/opt/rosi-collector/.env
To inspect the saved password:
sudo grep GRAFANA_ADMIN_PASSWORD /opt/rosi-collector/.env
ROSI Collector ships with dashboards such as:
Syslog Explorer
Syslog Analysis
Syslog Health
Node Overview
Alerting Overview
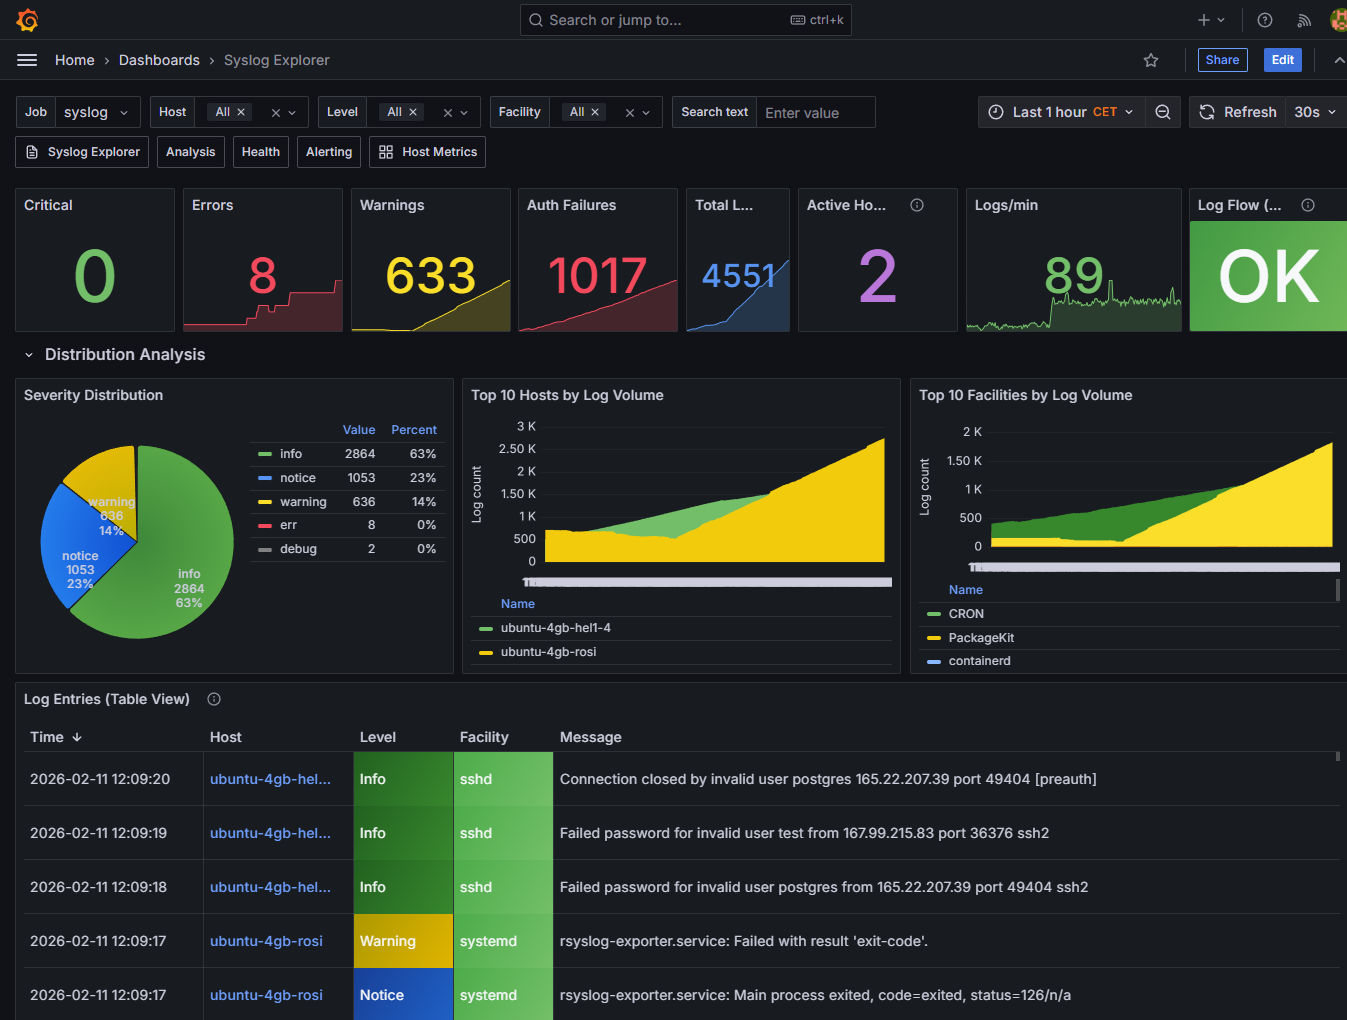
Example Grafana dashboards included with ROSI Collector.
As a quick verification step, open Syslog Explorer and search for the test
message you sent in Step 2. In Grafana Explore, example queries include:
If you also onboard Windows systems with rsyslog Windows Agent, their events become searchable in the same Grafana views alongside logs from Linux clients.
{host="webserver"}
{host=~".+"} |= "error"
{facility="auth"}
Step 4: Advanced Configuration
Once the basic stack is running, the most common next steps are:
Enable TLS or mTLS for syslog transport
Adjust Loki retention for your expected log volume
Add more clients and assign useful Prometheus labels
Review firewall rules in both the host OS and any cloud network controls
Use
rosi-monitorfor regular health checks
The canonical details live in the ROSI Collector deployment docs:
Step 5: Troubleshooting
Keep the first pass simple:
Check stack health with
sudo rosi-monitor health.Confirm containers are up with
sudo docker compose ps.Verify the client with
sudo rsyslogd -N1and a freshloggertest message.Verify Loki readiness with
curl http://localhost:3100/ready.Verify client metrics locally with
curl http://localhost:9100/metrics.
For specific failures such as downloads returning 404, Grafana access
problems, missing logs, Prometheus scrape failures, TLS issues, or storage
pressure, use Troubleshooting.
Conclusion
You now have a private ROSI Collector deployment that centralizes logs and metrics from multiple systems and makes them available in Grafana.
Next steps:
Add more client systems
Enable TLS or mTLS for production syslog transport
Tune retention and alerting for your environment
Explore the built-in dashboards and extend them as needed
Provider-specific
If you want a provider-focused variant of this tutorial, see the Hetzner Community version: Deploying a Private, Centralized Observability Stack with rsyslog ROSI.
See also
Support: rsyslog Assistant | GitHub Discussions | GitHub Issues: rsyslog source project
Contributing: Source & docs: rsyslog source project
© 2008–2026 Rainer Gerhards and others. Licensed under the Apache License 2.0.